Countries with the highest water availability, thousand m3 per person.
Countries with the lowest water availability, thousand m3 per person.
Hydropower is the energy from water used in hydroelectric power plants to produce electricity.
Hydropower potential is the potential of the waters of the land and the World Ocean. The world's hydropower potential is 10 trillion kWh.
Leading countries in hydropower resources Russia USA China Brazil Canada DR Congo
RESOURCES OF THE WORLD OCEAN Biological: 90% - fish. The most fish-producing seas: Norwegian, Bering, Okhotsk, Japanese. Ocean - Pacific. Sea water resources: contains 75 chemical elements. 1/3 of the world's table salt, 60% of magnesium, 90% of bromine and potassium are extracted. Mineral resources of the seabed: solid - placers of zirconium, gold, platinum, diamonds, ferromanganese nodules, coal, sulfur. Liquid - oil. Gaseous - natural gas. Energy: mechanical and thermal energy of the ocean, tides.
Copper deposits
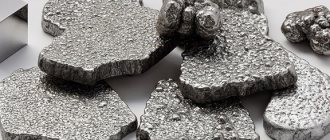
Metals in the copper subgroup are characterized by low chemical activity, for this reason they are found in the form of chemical compounds, as well as nuggets. Many centuries ago, copper could only be found in the form of sulfur compounds - chalcopyrite and chalcocite. This is because copper has a high chemical affinity for sulfur. Most primary ores contain copper in sulfide form - CuS. Over time, especially under conditions of volcanic activity, under the influence of large amounts of oxygen, copper sulfides became oxides. Copper nuggets were formed in nature during the strong heating of oxidized sulfur ore. For example, if oxidized copper minerals and sulfur ores lay under a thick layer of rock, they were heated by natural disasters and earthly heat. In such natural “metallurgical shops” colossal volumes of copper were smelted. A nugget weighing 420 tons was found in North America. However, this is rare; native copper on the planet is approximately 1%.
World copper deposits
A lot of copper, like other minerals, is located at the bottom of the oceans. At the bottom there are clusters of round stones containing approximately 0.5% copper. According to the analysis of geologists, the reserves of copper ore in the ocean reach 5 billion tons. There are almost 250 copper minerals, but only 20 are used industrially. The main copper ores include:
- chalcocite - Cu2S, which contains 79.8% copper
- chalcopyrite - CuFeS2, which contains 30% copper. This ore accounts for almost 50% of all copper deposits
- bornite - Cu5FeS4, contains from 52 to 65% copper
- covellite – CuS, contains 64% copper.
According to genetic and industrial-geological parameters, copper deposits are:
- stratiform, which include copper shales and sandstones
- pyrites. This group includes native and vein copper
- hydrothermal
- igneous, including the most common ores of the copper-nickel type
- carbonate. This group includes iron-copper and carbonatite ores.
Undeveloped Aynak copper deposit in Afghanistan
According to some sources, in particular the non-governmental organization Transparency International, Afghanistan has the largest copper reserves, which rank second in volume in the world. But most have not yet been fully studied and industrial extraction is not carried out.
Copper deposits in Afghanistan
Ainak is considered the largest, not only in Afghanistan, but also in the world. The main problems of its development arose as a result of a dispute between the mining company and archaeologists. The fact is that on the territory of the copper deposit, scientists found the ancient Buddhist city of Mes Aynak, which is of great historical value. Therefore, it was prohibited to develop the deposit of the same name.
The government plans to organize ore mining in the Ainak deposit at the level of 300 thousand tons per year, and gradually increase volumes.
Characteristics of the Ainak deposit:
- area – 5 km2;
- estimated copper reserves: central Aynak – 9.8 million tons;
- western Aynak – 9.9 million tons;
Assessment data for actual reserves of the Ainak field
Starting from 2011, it was planned to activate the Ainak field - to reach the level of 200 thousand tons in 2015. Now the deadlines have moved again - until 2022. We can only hope that Aynak will start working at full speed and will significantly improve the financial situation of the state, while at the same time preserving the cultural and historical value of the Buddhist city.
Copper reserves in the world
The largest amount of copper, approximately 65%, occurs in North and South America. European states have 15% of resources, Asian states - 11%, African states - 4.5%. The largest confirmed copper reserves are recorded in Chile. Almost 20% of the world's reserves are located there. And in the USA - 12.7%. In addition to these countries, there is a lot of copper in Poland, Indonesia, Iran, Kazakhstan, China, Uzbekistan, the Philippines, as well as in Zaire, Zambia, Brazil, Canada, Mexico, Panama, Peru and Australia. In each of these states, according to experts, there are about 10 million tons.
review
In 2022, global copper production was 20.4 million tonnes (2017: 20.0 million tonnes). By far the largest producing country was Chile (5.8 million tons), followed by Peru (2.4 million tons), People's Republic of China (1.6 million tons), USA (1.2 million tons) and DR Congo . (1.2 million tons). The share of these five countries in world production was 60.3%. In Europe, mention should be made of Russia, Poland, Bulgaria, Portugal and Sweden.
Copper smelting and refining is only partially carried out in the respective producing countries. In particular, China now smelts and refines a significant portion of the world's copper production. The following table provides an overview of the four countries with the largest volumes of refined copper.
Figures in millions of tons
| classify | a country | Funding (2017) | Melting (2016) | Recycling (2016) | |
| 1. | People's Republic of China People's Republic of China | 1,7 | 5.5 | 8.0 | |
| 2. | Chile Chile | 5.5 | 1.5 | 2,7 | |
| 3. | Japan Japan | USA USA | 1.3 | 0,5 | 1.2 |
Suitable reserves were estimated by the United States Geological Survey (USGS) in January 2022 at 870 million tons worldwide. Chile accounts for 200 million tons, Australia 87 million tons, Peru also 87 million tons, Russia 61 million tons and Mexico 53 million tons. These five countries together accounted for 56.1 percent of the world's reserves. The range of static reserves is approximately 43 years.
Copper mines on the Keweenaw Peninsula of Lake Superior/USA were historically significant (the world's largest deposit of native copper; mining dates back to pre-Columbian times). In Germany, copper slate was mined in the Mansfeld area until 1990.
Copper ore mining
Due to the low copper content in the ore, its extraction involves processing large volumes of rock. In order to smelt 1 ton of copper, over 200 tons of ore must be processed. Copper mining methods:
- open method. If ore deposits are located close to the earth's surface, then they are developed in this way; the depth of open-pit mining is 150-300 m. The method is characterized by lower losses
- underground method. Using this method, ore is mined from a depth of 500 m, and sometimes from 800-1000 m.
There are five technological systems for field development:
- using self-propelled equipment. This technology is widely used
- using continuous vibration mechanisms
- using hardening goaf backfill. In this case, there is a continuous excavation of reserves of powerful deposits with minimal losses. With the use of such systems, losses are reduced by 3-4 times
- method of extracting ore in horizontal layers. When filling goafs (in underground mines) with hardening compounds, pipes lined with rubber or basalt are used, the service life of which is 50-100 times higher than that of steel
- cyclic-flow technology for the implementation of mining operations.
promotion
Around the country
The following table shows all countries whose annual production in 2022 was more than 10,000 tons. The copper content in ores and concentrates is given. Copper has not been mined in Germany since the early 1990s. All figures refer to states within their current borders.
Figures in thousands of tons
| Rank (2018) | a country | 1970 | 1980 | 1990 | 2000 | 2010 | 2015 | 2016 | 2017 | 2018 |
| 1. | Chile Chile | 686 | 1,068 | 1,588 | 4 602 | 5 419 | 5772 | 5,553 | 5 504 | 5 832 |
| 2. | Peru Peru | 220 | 367 | 323 | 554 | 1,247 | 1,701 | 2354 | 2,446 | 2,437 |
| 3. | People's Republic of China People's Republic of China | 120 | 165 | 285 | 889 | 1,156 | 1,712 | 1 900 | 1,706 | 1,591 |
| 4th | USA USA | 1,560 | 1,181 | 1,588 | 1,444 | 1,110 | 1,416 | 1,462 | 1,290 | 1,250 |
| 5. | Democratic Republic of the Congo DR Congo | 386 | 462 | 352 | 33 | 378 | 1,039 | 1,024 | 1,095 | 1,225 |
| Sixth | Australia Australia | 158 | 244 | 330 | 832 | 871 | 996 | 948 | 849 | 913 |
| 7th | Zambia Zambia | 684 | 610 | 546 | 249 | 767 | 711 | 725 | 797 | 851 |
| 8th. | Russia, Russia | 387 | 400 | 643 | 530 | 703 | 711 | 702 | 762 | 785 |
| 9. | Mexico Mexico | 61 | 175 | 299 | 365 | 270 | 594 | 766 | 742 | 697 |
| 10. | Indonesia Indonesia | 59 | 162 | 1.012 | 863 | 579 | 728 | 622 | 651 | |
| 11. | Kazakhstan Kazakhstan | 138 | 143 | 230 | 430 | 381 | 474 | 475 | 558 | 636 |
| 12th | Canada Canada | 610 | 716 | 794 | 634 | 522 | 715 | 693 | 597 | 539 |
| 13th | Mongolia Mongolia | 44 year | 124 | 126 | 128 | 318 | 516 | 475 | 459 | |
| 14th | Poland Poland | 83 | 343 | 370 | 454 | 426 | 426 | 424 | 419 | 401 |
| 15th | Brazil Brazil | 4th | 34 | 32 | 214 | 359 | 338 | 385 | 381 | |
| 16. | Iran Iran | 1 | 67 | 147 | 257 | 246 | 289 | 296 | 317 | |
| 17th | Spain Spain | 10 | 49 | 13th | 25th | 54 | 113 | 168 | 198 | 185 |
| 18th | Myanmar Myanmar | 10 | 71 | 95 | 116 | 154 | ||||
| 19th | Laos Laos | 132 | 168 | 178 | 153 | 147 | ||||
| 20th | Bulgaria Bulgaria | 42 | 62 | 33 | 93 | 113 | 112 | 110 | 109 | 109 |
| 21st | Sweden Sweden | 26th | 43 years old | 74 | 78 | 77 | 75 | 79 | 104 | 106 |
| 22nd | Uzbekistan Uzbekistan | 42 | 43 years old | 69 | 70 | 80 | 100 | 100 | 100 | 100 |
| 23 | Papua New Guinea Papua New Guinea | 147 | 170 | 203 | 160 | 45 | 80 | 105 | 96 | |
| 24 | Armenia Armenia | 1 | 1 | 1 | 12th | 31 year | 84 | 103 | 114 | 84 |
| 25th | turkey turkey | 31 year | 21 years old | 40 | 76 | 80 | 108 | 100 | 83 | 80 |
| 26th | Philippines Philippines | 160 | 305 | 181 | 32 | 58 | 84 | 84 | 68 | 70 |
| 27 | Saudi Arabia Saudi Arabia | 2 | 12th | 28 | 36 | 68 | ||||
| 28. | Portugal Portugal | 4th | 4th | 160 | 76 | 74 | 83 | 74 | 64 | 49 |
| 29 | South Africa South Africa | 144 | 201 | 188 | 148 | 103 | 77 | 65 | 66 | 47 |
| 30's | Finland Finland | 31 year | 53 | 18th | 12th | 15th | 41 years old | 47 | 53 | 47 |
| 31. | Serbia Serbia | 85 | 107 | 129 | 46 | 23 | 30's | 41 years old | 45 | 44 year |
| 32. | India India | 10 | 27 | 52 | 38 | 32 | 32 | 32 | 34 | 37 |
| 33. | Mauritania Mauritania | 37 | 45 | 33 | 29 | 28 | ||||
| 34. | Morocco Morocco | 15th | 20th | 24 | 25th | 24 | ||||
| 35. | Vietnam Vietnam | 12th | 23 | 23 | 21 years old | 23 | ||||
| 36. | Argentina Argentina | 1 | 145 | 140 | 62 | 82 | 33 | 17th | ||
| 37. | Eritrea Eritrea | 62 | 25th | 8th | 17th | |||||
| 38. | Pakistan Pakistan | 20th | 16 | 14th | 15th | 17th | ||||
| 39. | Namibia Namibia | 23 | 39 | 28 | 5 | 14th | 17th | 16 | 15th | |
| 40. | Georgia Georgia | 3 | 3 | 4th | 9 | 11 | 13th | 14th | 15th | 13th |
| 41. | Colombia Colombia | 2 | 1 | 5 | 8th | 9 | 10 |
By company
The company, the country in which it is located, the volume of production and the share of world production are listed.
Figures in thousands of tons (2017)
| classify | Companies | a country | quantity | Ownership % |
| 1. | Codelco | Chile Chile | 1840 | 9.1 |
| 2. | Freeport-McMoRan | USA USA | 1436 | 7.1 |
| 3. | Glencore | Switzerland Switzerland | 1247 | 6.2 |
| 4th | Grupo Mexico | Mexico Mexico | 883 | 4.4 |
| 5. | BHP Billiton | Australia Australia United Kingdom United Kingdom | 796 | 3.9 |
| Sixth | KGHM Polska Mied | Poland Poland | 553 | 2,7 |
| 7th | The first quantum minerals | Canada Canada | 513 | 2,5 |
| 8th. | Rio Tinto Group | Australia Australia United Kingdom United Kingdom | 499 | 2,5 |
| 9. | Antofagasta plc | United Kingdom United Kingdom | 486 | 2.4 |
| 10. | Group of Minerals and Metals | Australia Australia | 445 | 2.2 |
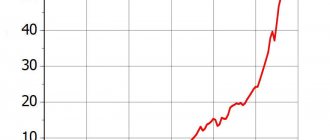
Global funding
The following table shows global production in thousands of tons.
Figures in thousands of tons
| 495 | |
| 1901 | 526 |
| 1902 | 555 |
| 1903 | 596 |
| 1904 | 660 |
| 1905 | 713 |
| 1906 | 724 |
| 1907 | 721 |
| 1908 | 744 |
| 1909 | 828 |
| 1910 | 858 |
| 1911 | 890 |
| 1912 | 1,000 |
| 1913 | 996 |
| 1914 | 938 |
| 1,060 | |
| 1916 | 1,420 |
| 1917 | 1,430 |
| 1918 | 1,430 |
| 1919 | 994 |
| 1920 | 959 |
| 1921 | 558 |
| 1922 | 884 |
| 1923 | 1,270 |
| 1924 | 1,360 |
| 1925 | 1,530 |
| 1926 | 1,510 |
| 1927 | 1,520 |
| 1928 | 1,730 |
| 1929 | 1,950 |
| 1,610 | |
| 1931 | 1,400 |
| 1932 | 909 |
| 1933 | 1,050 |
| 1934 | 1,280 |
| 1935 | 1,500 |
| 1936 | 1,720 |
| 1937 | 2290 |
| 1938 | 1,990 |
| 1939 | 2,130 |
| 1940 | 2400 |
| 1941 | 2,480 |
| 1942 | 2,590 |
| 1943 | 2 620 |
| 1944 | 2,460 |
| 2,110 | |
| 1946 | 1,780 |
| 1947 | 2,130 |
| 1948 | 2,210 |
| 1949 | 2,140 |
| 1950 | 2380 |
| 1951 | 2,490 |
| 1952 | 2,570 |
| 1953 | 2600 |
| 1954 | 2640 |
| 1955 | 2 900 |
| 1956 | 3 200 |
| 1957 | 3 300 |
| 1958 | 3 190 |
| 1959 | 3 430 |
| 3 940 | |
| 1961 | 4 090 |
| 1962 | 4220 |
| 1963 | 4290 |
| 1964 | 4 450 |
| 1965 | 4 660 |
| 1966 | 4,580 |
| 1967 | 4 630 |
| 1968 | 5,010 |
| 1969 | 5 520 |
| 1970 | 5 900 |
| 1971 | 5 940 |
| 1972 | 6 540 |
| 1973 | 6 920 |
| 1974 | 7 100 |
| 6 740 | |
| 1976 | 7 260 |
| 1977 | 7 420 |
| 1978 | 7 280 |
| 1979 | 7,350 |
| 1980 | 7 200 |
| 1981 | 7 690 |
| 1982 | 7 580 |
| 1983 | 7 610 |
| 1984 | 7 810 |
| 1985 | 7 990 |
| 1986 | 7 940 |
| 1987 | 8 240 |
| 1988 | 8 720 |
| 1989 | 9 040 |
| 9 200 | |
| 1991 | 9 330 |
| 1992 | 9 470 |
| 1993 | 9 490 |
| 1994 | 9 500 |
| 1995 | 10 000 |
| 1996 | 11 000 |
| 1997 | 11 500 |
| 1998 | 12 100 |
| 1999 | 12 800 |
| 2000 | 13 200 |
| 2001 | 13 700 |
| 2002 | 13 600 |
| 2003 | 13 800 |
| 2004 | 14 700 |
| 2006 | 15 100 |
| 2007 | 15 500 |
| 2008 | 15 600 |
| 2009 | 16 000 |
| 2010 | 16 100 |
| 2011 | 16 300 |
| 2012 | 16 900 |
| 2013 | 18 300 |
| 2014 | 18 500 |
| 2015 | 19 100 |
| 2016 | 20 100 |
| 2017 | 20 000 |
| 2018 | 20 400 |
| 2019 e | 20 000 |
Copper production centers
Copper production centers are present in different regions of Russia. Kazakhstan boasts the richest ore deposits. There are also deposits in the Urals. According to the latest data, Russia ranks first in the world in copper ore mining. Copper plants are being built in close proximity to the mines. The raw material factor is the determining component, due to the low content of concentrates in the feedstock. There are 11 copper complexes in the Urals, producing 43% of the country’s copper. In addition to our own raw materials, production also uses those imported from Kazakhstan. There are also waste recycling plants. For example, sulfur dioxide gases, as a byproduct of copper mining, are used to create sulfuric acid, which is then used to make fertilizers.
Source
Sredneuralsky plant: characteristics.
As mentioned above, the Sredneuralsk Copper Plant (SUMZ) is one of the main copper smelting centers in our country. This plant is located in the city of Revda, in the Sverdlovsk region. SUMZ belongs to the Ural Mining and Metallurgical Company, and is also a member of the regional industrial chamber.
Copper deposits and mining
But before you start mining, the substrate will need to be examined more closely. With further drilling and sound waves, the best production sites should be explored by next year. According to von der Linden, 700 million euros will be invested in the construction of the mine. The operating company hopes to promote copper worth at least €300 million per year for 20 years. Shiny metal plates emerge from the black rubble. The copper sheets from the dining table, each weighing more than 100 kilograms, are eventually sold to industry. It is much more common in jewelry making than copper. Often you think about magnetic bracelets made of copper, which are supposed to have a healing effect. However, many people know that copper is also used as a material.
At SUMZ, copper is smelted from primary raw materials, which are taken from the Degtyarskoye deposit.
The Sredneuralsk Copper Smelter has a large copper smelting workshop, an enrichment plant, as well as xanthate and sulfuric acid workshops. The plant also has a number of auxiliary enterprises that serve the needs of the copper smelter.
When did people start winning copper?
But nowadays copper has been brought out of the flood and is used mainly for its beautiful color for jewelry. What properties make the material a suitable raw material for jewelry? The history of copper is long because copper is very easy to work with, people really enjoy making objects from this material at an early stage. In addition to gold, silver and tin, copper was the first metal that people recognized and appreciated. Copper finds a date as far back as a thousand years ago. It was even referred to as the Copper Age, when copper was used and processed excessively. SUMZ produces about one hundred tons of blister copper annually. Copper concentrates at this plant are processed by firing in fluidized bed furnaces, and the method of converting and reflective smelting of the cinder is also used.
The products of the Serdneuralsk plant are supplied to all large Russian enterprises operating in the metallurgical, mining and chemical industries and located in different regions of the country, as well as abroad.
Almost everything at that time was made of copper. At that time, copper mining strongholds were found in Jordan and the former Roman Empire, where up to 000 tons of copper were produced annually. Copper is what is called a semi-precious metal, so it does not have the value of the precious metals gold and silver. However, copper has very good properties that are in no way inferior to silver and gold. Since copper has always been mass produced, its reputation is of course not as good as precious metals, which cannot be won as easily or in harsh quantities.
Ferrous metal ores (Iron ore)
Among ferrous metal ores, the most popular and used in industry are iron ores.
Iron ore is the basis for the production of ferrous metals - cast iron, steel, rolled products.
- The largest reserves of iron ore are concentrated in the USA, India, China, Brazil, and Canada.
- There are separate large deposits in Kazakhstan, France, Sweden, Ukraine, Venezuela, Peru, Chile, Australia, Liberia, Malaysia, and North African countries.
- In Russia, large reserves of iron ore, in addition to KMA, are in the Urals, the Kola Peninsula, and Karelia.
Natural resources
Nature management and ecology
Basic concepts, processes, patterns and their consequences
Water resources
distributed extremely unevenly. The leaders in the provision of river flow resources per capita are the Democratic Republic of Congo, Canada, Norway, New Zealand, Liberia; the minimum indicators are in Egypt, Saudi Arabia, South Africa, and Poland.
Land resources
include the following types of land: arable land (11%), pastures (24%), forest land (31%), the rest of the Earth is not used.
Mineral resources
It is customary to subdivide into
fuel and energy, ore, and non-
metallic minerals.
Almost all of them are classified as non-renewable.
Of the fuel and energy resources, oil, gas and coal are of greatest importance. From total coal
40% comes from brown coal, 60% from hard coal.
The largest coal basins are Tunguska, Lensky, Kansko-Achinsky, Kuznetsk, Ruhr, Appalachian, Pechersky, Taimyr. The largest oil and gas
basins: the Persian Gulf, Maracaiba, Orinoco, Gulf of Mexico, Texas, Illinois, California, Western Canada, West Siberian, Sumatra, Gulf of Guinea, Sahara.
Ore
minerals correspond to the foundations and overhangs of ancient platforms and folded areas.
Large ore belts
— Alpine-Himalayan, Pacific, etc.
Non-metallic
minerals include rocks and minerals used in construction, chemical industry, etc. World forest resources are characterized by two main indicators: the size of forest area (4.1 billion hectares) and reserves wood (333 billion m3). There are two vast forest belts - northern and southern.
Natural resources
- these are all types of natural resources directly used by man or used by him for the production of material assets.
Natural conditions
- these are the properties of the natural environment, the components of which have an impact on production and humans, but are not directly used by them.
Nature management
- the activity of human society aimed at satisfying its needs through the use of natural resources.
Rational environmental management
- a system of environmental management in which extracted natural resources are used quite fully (and accordingly the amount of consumed resources is reduced), the restoration of renewable natural resources is ensured, production waste is fully and repeatedly used, which allows reducing environmental pollution. Rational use of natural resources is characteristic of intensive farming.
Resource availability
— the relationship between the amount of natural resources and the extent of their use. It is expressed by the number of years for which a given resource should last, or its reserves per capita of a given territory.
Top ten countries by freshwater resources
| A country | Resources, km 3 | A country | |
| Brazil | 6950 | 2480 | USA |
| Russia | 4300 | 2360 | Bangladesh |
| Canada | 2900 | 2085 | India |
| China | 2800 | 1320 | Venezuela |
| Indonesia | 2530 | 1100 | Myanmar |
Leading countries in reserves of fuel and energy minerals
| Fossils | Leading countries in reserves |
| Coal | USA, China, Russia, India, South Africa, Australia |
| Brown coal | Russia, USA, Australia, Germany |
| Oil | Saudi Arabia, Iraq, Kuwait, UAE, Venezuela |
| Gas | Russia, Iran, Qatar, UAE, Saudi Arabia, Turkmenistan |
Leading countries in ore reserves
| Fossils | Leading countries in reserves |
| Iron ore | Russia, Brazil, China, Australia, USA, India, Canada, Ukraine |
| Bauxite (aluminum ore) | Australia, Guinea, Brazil, Jamaica, Suriname, Guyana, China |
| Copper ore | Chile, USA, Congo (Zaire), Zambia, Canada, Russia, China, Kazakhstan |
| Manganese ores | South Africa, Australia, Gabon, Brazil, Ukraine |
| Tin ores | Malaysia, Brazil, Indonesia, Vietnam, Myanmar, China, Russia, Bolivia, South Africa |
| Gold | USA, South Africa, Australia, Canada, Russia |
Leading countries in reserves of non-metallic minerals
| Fossils | Leading countries in reserves |
| Diamonds | South Africa, Russia, Namibia, Australia, Botswana |
| Phosphorites | Kazakhstan, Morocco, South Africa, Australia, Algeria |
| Potassium salts | Belarus, Germany, Brazil |
| Sulfur | Ukraine, Italy, Turkmenistan, Iraq |
| Belt | Area, billion hectares | Rock composition | Areas of distribution |
| Northern | 2 | Coniferous – 67% Deciduous – 33% | Russia, Canada, USA, Nordic countries |
| Southern | 2 | Broadleaf – 97% | Brazil, DR Congo, Congo (Zaire), Indonesia, India, Myanmar, Venezuela, etc. |
Top ten countries by arable land area
| A country | Arable area | |
| million hectares | in % of the land fund | |
| USA | 185,7 | 20,3 |
| India | 166,1 | 55,9 |
| Russia | 116,1 | 6,9 |
| China | 92,5 | 9,9 |
| Australia | 47,0 | 6,1 |
| Canada | 45,4 | 4,9 |
| Brazil | 43,2 | 5,0 |
| Kazakhstan | 34,8 | 13,1 |
| Ukraine | 33,3 | 56,9 |
| Nigeria | 30,2 | 33,0 |
Measures to combat the negative consequences of human economic activity
Copper production centers
Copper production centers are present in different regions of Russia. Kazakhstan boasts the richest ore deposits. There are also deposits in the Urals. According to the latest data, Russia ranks first in the world in copper ore mining. Copper plants are being built in close proximity to the mines. The raw material factor is the determining component, due to the low content of concentrates in the feedstock. There are 11 copper complexes in the Urals, producing 43% of the country’s copper. In addition to our own raw materials, production also uses those imported from Kazakhstan. There are also waste recycling plants. For example, sulfur dioxide gases, as a byproduct of copper mining, are used to create sulfuric acid, which is then used to make fertilizers.
There are not many metals on our planet whose production volumes exceed those of copper. The twenty-ninth number in Mendeleev’s periodic table is in honorable third place in terms of production levels, right after iron and aluminum. Too many industries would be in trouble if their storerooms suddenly ran out of much-needed metal. The importance of copper and copper ore can hardly be overestimated for electrical engineering, heating engineering, metallurgy, medicine and even transport.
How copper differs from other metals and how copper is mined will be discussed below.
Production and export
Smelting by country
All figures refer to states within their current borders.
Figures in thousands of tons
| Rank (2018) | a country | 1970 | 1980 | 1990 | 2000 | 2010 | 2016 | 2017 | 2018 |
| 1. | People's Republic of China People's Republic of China | 120 | 175 | 358 | 1.014 | 2 826 | 6,115 | 5 966 | 6 357 |
| 2. | Japan Japan | 603 | 929 | 1,041 | 1,331 | 1,356 | 1,290 | 1,192 | 1,263 |
| 3. | Chile Chile | 647 | 953 | 1,329 | 1,460 | 1,560 | 1,365 | 1,265 | 1,246 |
| 4th | Zambia Zambia | 683 | 601 | 355 | 180 | 535 | 698 | 788 | 829 |
| 5. | Russia, Russia | 368 | 516 | 954 | 550 | 647 | 665 | 730 | 754 |
| Sixth | USA USA | 1,489 | 1,008 | 1,158 | 862 | 601 | 563 | 470 | 536 |
| 7th | Korea, South South Korea | 5 | 64 | 161 | 371 | 476 | 510 | 510 | 530 |
| 8th. | India India | 9 | 28 | 41 years old | 256 | 654 | 773 | 823 | 492 |
| 9. | Poland Poland | 69 | 367 | 430 | 463 | 470 | 447 | 458 | 462 |
| 10. | Australia Australia | 112 | 175 | 192 | 391 | 410 | 445 | 360 | 378 |
| 11. | Peru Peru | 177 | 349 | 261 | 340 | 313 | 309 | 317 | 328 |
| 12th | Bulgaria Bulgaria | 40 | 59 | 30's | 163 | 247 | 245 | 323 | 317 |
| 13th | Germany Germany | 134 | 170 | 198 | 211 | 379 | 343 | 333 | 311 |
| 14th | Iran Iran | 79 | 156 | 188 | 153 | 114 | 304 | ||
| 15th | Kazakhstan Kazakhstan | 165 | 230 | 426 | 414 | 354 | 294 | 296 | 295 |
| 16. | Canada Canada | 465 | 493 | 476 | 544 | 318 | 304 | 289 | 290 |
| 17th | Mexico Mexico | 60 | 86 | 210 | 308 | 169 | 268 | 270 | 286 |
| 18th | Spain Spain | 55 | 103 | 121 | 290 | 259 | 292 | 272 | 285 |
| 19th | Indonesia Indonesia | 174 | 263 | 256 | 246 | 259 | |||
| 20th | Philippines Philippines | 153 | 150 | 216 | 215 | 240 | 171 | ||
| 21st | Sweden Sweden | 37 | 46 | 76 | 105 | 142 | 132 | 150 | 150 |
Oil refinery production
Around the country
All figures refer to states within their current borders.
Figures in thousands of tons
| Rank (2018) | a country | 1970 | 1980 | 1990 | 2000 | 2010 | 2016 | 2017 | 2018 |
| 1. | People's Republic of China People's Republic of China | 120 | 295 | 558 | 1,371 | 4,540 | 8 436 | 8 970 | 9 029 |
| 2. | Chile Chile | 452 | 811 | 1,192 | 2668 | 3 244 | 2 613 | 2,430 | 2,461 |
| 3. | Japan Japan | 713 | 1.014 | 1,008 | 1,437 | 1,549 | 1,553 | 1,488 | 1,595 |
| 4th | USA USA | 1444 | 1,730 | 2,017 | 1 802 | 1,095 | 1,220 | 1,080 | 1,070 |
| 5. | Russia, Russia | 346 | 502 | 722 | 842 | 900 | 860 | 949 | 1,039 |
| Sixth | Democratic Republic of the Congo DR Congo | 29 | 259 | 819 | 825 | 1,000 | |||
| 7th | Germany Germany | 440 | 425 | 532 | 709 | 704 | 671 | 694 | 672 |
| 8th. | Korea, South South Korea | 7th | 88 | 192 | 471 | 565 | 645 | 663 | 665 |
| 9. | Poland Poland | 93 | 357 | 346 | 486 | 547 | 536 | 522 | 502 |
| 10. | Zambia Zambia | 534 | 608 | 426 | 226 | 767 | 426 | 466 | 458 |
| 11. | India India | 10 | 23 | 46 | 260 | 512 | 788 | 831 | 450 |
| 12th | Kazakhstan Kazakhstan | 199 | 288 | 414 | 395 | 323 | 408 | 426 | 438 |
| 13th | Mexico Mexico | 53 | 97 | 157 | 343 | 247 | 462 | 446 | 437 |
| 14th | Spain Spain | 111 | 154 | 171 | 316 | 348 | 429 | 415 | 424 |
| 15th | Australia Australia | 127 | 182 | 274 | 509 | 424 | 475 | 386 | 408 |
| 16. | Belgium Belgium | 326 | 526 | 332 | 423 | 381 | 367 | 399 | 390 |
| 17th | Peru Peru | 33 | 224 | 182 | 452 | 394 | 331 | 335 | 337 |
| 18th | Canada Canada | 478 | 505 | 516 | 551 | 320 | 314 | 330 | 291 |
| 19th | Indonesia Indonesia | 158 | 279 | 253 | 271 | 275 | |||
| 20th | Iran Iran | 1 | 48 | 181 | 220 | 193 | 161 | 239 | |
| 21st | Sweden Sweden | 35 year | 56 | 97 | 133 | 190 | 207 | 219 | 224 |
By company
The list includes company, headquarters, refinery, and share of global production.
Figures in thousands of tons (2009)
| classify | Companies | a country | quantity | Ownership % |
| 1. | Codelco | Chile Chile | 1881 | 10,4 |
| 2. | Aurubis AG | Germany Germany | 1092 | 6.0 |
| 3. | Freeport-McMoRan | USA USA | 1028 | 5,7 |
| 4th | Jiangxi Copper | People's Republic of China People's Republic of China | 804 | 4.4 |
| 5. | Xstrata | Switzerland Switzerland | 761 | 4.2 |
| Sixth | Nippon Mining & Metals Company | Japan Japan | 666 | 3,7 |
| 7th | BHP Billiton | Australia Australia United Kingdom United Kingdom | 587 | 3.2 |
| 8th. | Sumitomo mining industry | Japan Japan | 529 | 2,9 |
| 9. | LS-Nikko Copper | Korea, South South Korea | 519 | 2,9 |
| 10. | Mitsubishi materials | Japan Japan | 506 | 2,8 |
| 11. | KGHM Polska Mied | Poland Poland | 503 | 2,8 |
Copper exports by country
The following table shows countries according to their copper exports. 2012 data in millions of dollars, as reported by the Observatory of Economic Complexity. The top ten countries are listed.
| # | a country | Cost in millions of US dollars |
| 1 | Chile Chile | 21 962 |
| 2 | Japan Japan | 4,542 |
| 3 | Kazakhstan Kazakhstan | 3 637 |
| 4th | Australia Australia | 2 904 |
| 5 | Poland Poland | 2 672 |
| Sixth | Russia, Russia | 2,528 |
| 7th | Zambia Zambia | 2 349 |
| 8th | India India | 2,248 |
| 9 | Germany Germany | 2,106 |
| 10 | Peru Peru | 1 989 |
Aluminum industry
Aluminum is the most common non-ferrous metal in the earth's crust.
Aluminum production can be divided into three parts:
- Extraction of raw materials for the aluminum industry - bauxite
- Bauxite is processed into alumina
- Aluminum is produced from molten alumina
- Primary aluminum is aluminum that is produced from raw materials - bauxite.
- Secondary aluminum - remelted aluminum (The industry of developed countries is aimed at the production of secondary aluminum)
Rating of countries for bauxite mining:
- Guinea
- Australia
- Brazil
- Jamaica
- Cameroon
- India
Bauxite is predominantly found in the humid tropics and subtropics.
Map showing which countries are leading in bauxite mining
Aluminum Industry Location Factors
1) Raw materials
- Enterprises are located near sources of raw materials - bauxite or alumina.
- When producing secondary aluminum, enterprises are located near large consumers of aluminum.
2) Energy
- Aluminum production requires a lot of energy, so enterprises are located near sources of cheap electricity (for example, in Brazil this is hydropower, in the Gulf countries cheap energy is generated by thermal power plants).
3) Water
- Aluminum production requires a large amount of water, so plants are most often located near large rivers.
Example:
What factors contributed to the location of a large primary aluminum production plant in Krasnoyarsk.
1) A large river, the Yenisei, flows in the Krasnoyarsk Territory, and aluminum production is a water-intensive industry
2) The Krasnoyarsk region is provided with cheap electricity due to powerful hydroelectric power stations.
Metallurgy
150,000₽ prize fund • 11 honorary documents • Certificate of publication in the media
METALLURGY
Heavy industry sector Includes mining, beneficiation of ore resources and production of ferrous and non-ferrous metals. Features of the industry: material consumption, multi-stage production process, high environmental load
Iron ore mining and beneficiation
Cast iron, steel, rolled products, ferroalloys
Extraction of raw materials and their enrichment
Factors for the location of ferrous metallurgy: Raw materials - the industry gravitates towards deposits of coal and iron ore; Energy – the industry is energy-intensive, therefore it focuses on cheap sources of electricity; Transport – gravitates towards the flow of raw materials necessary for production; Consumer – The industry is consumer-oriented.
Main areas of iron ore mining and steel smelting
Leading countries in iron ore reserves: Australia, Brazil, Russia, China, India.
Leading countries in iron ore production: China, Australia, Brazil, India, Russia
LARGEST IRON ORE BASIN: KMA (Russia), Krivoy Rog (Ukraine), Carajas (Brazil), Lorraine (France), Newfoundland (Canada), Lake Superior Iron Ore Region (USA)…
PRODUCTION BASE OF FERROUS METALLURGY
Full cycle enterprises
Part-time enterprises
Ore mining; Processing and enrichment; Iron production; Steel production; Production of rolled products.
They are engaged in the production of either cast iron and steel, steel and rolled products.....
Production of steel and rolled products from scrap metal; They operate as part of large machine-building enterprises.
Leading countries in cast iron production: China, Japan, India, Russia, Republic of Korea.
Leading countries in steel production: China, Japan, India, USA, Russia.
WORLD CENTERS OF FERROUS METALLURGY
ASIAN – the leading and fastest growing of the centers, rich in raw materials. The region has the oldest leader in iron and steel industry - Japan and new dynamically developing leaders - China, India, Republic of Korea
EUROPEAN is the oldest metallurgical center in the world. The leaders of the region are Germany, France, Italy, Great Britain. Due to the deteriorating environmental situation, it is actively switching to imported raw materials, so ferrous metallurgy plants are increasingly appearing in the area of port cities.
NORTH AMERICAN , leader of the region - USA, the region has changed its international specialization: instead of large plants, small factories are being created here for the production of high-quality steel
NON-FERROUS METALLURGY A branch of heavy industry engaged in the extraction of ores and the production of non-ferrous metals and their alloys.
PLACEMENT FACTORS: Raw materials; Energy; Water; Consumer; Ecological;
Heavy: copper, lead, zinc, tin, nickel
Lightweight: aluminum, magnesium, titanium
Minor: bismuth, cadmium, antimony, arsenic, cobalt, mercury
Alloying materials: tungsten, molybdenum, tantalum, niobium, vanadium
Noble: gold, silver, platinum
Disseminated (rare earth): zirconium, gallium, indium, thallium, germanium, selenium
Volumes of metal production in the structure of non-ferrous metallurgy
Raw materials: bauxite, nepheline, alunite Main consumer: mechanical engineering (1st place - aerospace industry), electric power industry. Technological chain: Bauxite mining: Australia, Guinea, Jamaica, Brazil, China, Suriname, Russia, Venezuela, India, Kazakhstan, Greece, Hungary. Obtaining primary aluminum: aluminum oxide (alumina), where there is fuel and lime. Obtaining secondary aluminum from scrap metal and extracting the metal through electrolysis (where there is cheap electricity). Production of aluminum alloys
Products: blister copper, refined copper, alloys Main consumer: mechanical engineering (automotive industry, instrument making). Technological chain: Copper ore mining - Russia, Chile, USA, Zambia, DR Congo, Kazakhstan, Canada, Peru, Mexico, China, Australia, Poland, Papua New Guinea. 2. Enrichment (concentrate contains 35% copper) - USA, Chile, Japan, Zambia, Zaire, Canada. 3. Production of refined copper (98% copper) - USA, Russia, Kazakhstan, Chile, Japan, Russia, Kazakhstan, Canada, China, Germany, Poland. 3. Alloys: brass (+zinc), bronze (+tin), beryllium bronze.
Regions for the extraction of non-ferrous metal ores
USA, Australia, Canada, Russia, Kazakhstan, Mexico, Peru, China, Germany
Malaysia, Thailand, Indonesia, China, Russia, Nigeria, DR Congo, Rwanda, Bolivia, Brazil
USA, Australia, Canada, Russia, Kazakhstan, Mexico, Peru, China, Germany + Japan, France, Italy, UK
Nickel: Russia, Canada, New Caledonia, Cuba
PRECIOUS METALS INDUSTRY
Leading countries in gold mining: China, Australia, Russia, USA, Canada.
Leading countries in silver mining: Mexico, Peru, China, Chile, Australia
Leading countries in platinum production: South Africa, Russia, Zimbabwe, Canada, USA.
Our contacts
680009, Khabarovsk, st. Khabarovskaya, 15v, office. 308 Phone: +7 (4212) 45‒03‒99
true - Vacancies (unify_v_vacancyjob) - 703.219µs - 2020-08-04 02:56:49.991449858 +0000 UTC m=+83166.561417201 true - Banner (vip1) (unify_v_banner_vip1) - 1.025953ms - 2020- 08-04 02:56:49.991152764 +0000 UTC m=+83166.561120098 true — Footer_1 (unify_v_footer_1) — 907.716µs — 2020-08-04 02:56:49.991310577 +0000 UTC m=+83166.561277915 true — Events (unify_v_measure ) — 1.290101ms — 2020-08-04 02 :56:49.991276002 +0000 UTC m=+83166.561243350 true — Auction news (briefly) (unify_v_textlist) — 1.746801ms — 2020-08-04 02:56:49.990869085 +0000 UTC m=+83166.560836 402 true — Banner vip2 (unify_v_banner_vip2) — 1.684744ms — 2020-08-04 02:56:49.99119726 +0000 UTC m=+83166.561164577 true — Counter (unify_v_counter) — 1.804779ms — 2020-08-04 02:56:49.991109657 +00 00 UTC m=+83166.561076997 true — News general (briefly) (unify_v_newsGlobal) - 1.951658ms - 2020-08-04 02:56:49.991018539 +0000 UTC m=+83166.560985898 true - Navigator (unify_v_header) - 1.597818ms - 2020-08-04 02: 56:49.991384874 +0000 UTC m=+83166.561352228 true — Directories (unifu_v_catalog) — 1.938475ms — 2020-08-04 02:56:49.991236896 +0000 UTC m=+83166.561204270 false — News output (unify_v_window) — 42.45 6988ms – 2020-08-04 02: 56:49.991415652 +0000 UTC m=+83166.561383000 false — Mineral resources (unify_v_minres) — 206.565551ms — 2020-08-04 02:56:49.990955433 +0000 UTC m=+83166.5609227 92 false - Breadcrumbs (unify-breadcrumbs) - 306.043545ms — 2020-08-04 02:56:49.991349864 +0000 UTC m=+83166.561317220 false — HEAD (unify_v_htmlhead) — 917.367486ms — 2020-08-04 02:56:49.991065261 +0000 UTC m=+8 3166.561032618
Copper industry
- Copper is one of the most common and most valuable non-ferrous metals
- The electrical industry is the largest consumer of copper
- Most often, copper ore is mined together with nickel ore.
- The production of pure copper (refined) requires large amounts of electricity
Most copper mined : Chile, Peru, Russia, Australia and Canada
Rating of countries by copper smelting:
- Chile
- China
- Peru
- USA
- Australia
- Russia
Map showing which countries are leading in copper smelting
The US is not only a major producer of refined copper, but even imports copper.
Reason: developed production of electrical products