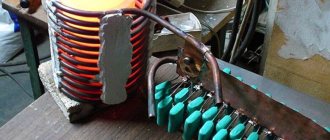
What does the melting temperature depend on?
Substances begin to melt at different temperatures. The temperature at which metals transform into liquid depends on two factors:
- purity of the substance (impurities give the system greater and less stability);
- chemical structure, composition (some alloys turn into a liquid state at temperatures above 200°C, and others at 2500°C).
The features of different melting temperatures are used in the metallurgical industry. Resistance to heat is increased by alloying steel, i.e. changing the chemical composition.
Content
The same substance can be in three different states of aggregation depending on conditions. For example, ice, water and water vapor (Figure 1).
Figure 1. Aggregate states of one substance using the example of ice, water and steam
Accordingly, it is one substance in solid, liquid and gaseous states. These states differ from each other in location, nature of movement and interaction of molecules . In liquids and solids, unlike gases, molecules cannot move far away from each other. Initially, they are located close to each other and their average kinetic energy is insufficient to do the work to overcome the forces of molecular attraction.
However, in practice we often observe how bodies pass from a solid to a liquid state, and vice versa. For example, the process of ice melting or freezing. In this lesson we will take a closer look at these processes and find out under what conditions they occur.
How to determine the melting point?
There are several methods for experimentally determining the melting point.
- Capillary method The crushed solid must be placed in an open-ended capillary. The capillary is heated under such conditions that the thin glass does not burst. When all the substance passes into the liquid phase, the temperature is recorded.
- Open capillary method This method is similar to the previous one, but instead of a closed capillary, an open one is used.
- Instant melting Ground portions of the dry substance are placed on a metal block heated to a temperature 10°C below the reference melting temperature. Adjust the heating so that the temperature increases by 1°C per minute. Then record the initial temperature t1, at which the substance acquires the properties of a liquid immediately after contact with the block. After finding this value, the heating is stopped and the place of contact between the block and the substance is cleaned. With gradual cooling, continue to place portions of the substance on the block. In this way, the final temperature t2 is established, at which the substance stops melting.
Formula for determining the melting point using the “instant melting” method:
Tmel = (t1 + t2) / 2
To determine the melting point of solid substances that quickly turn into powder, methods No. 1 and No. 3 are used, and for amorphous substances that melt at temperatures below 100 ° C, method No. 2 is used.
The melting point cannot be determined theoretically using formulas. You can get acquainted with it in a special chemical reference book.
Examples
Further information: List of elements by melting point
Melting points (in blue) and boiling points (in pink) of the first eight carboxylic acids (°C)
For most substances, melting and freezing scores are approximately equal. For example, melting point and
Mercury's freezing point is 234.32 Kelvin (−38.83 °C or −37.89 °F).[2] However, some substances have different solid-liquid transition temperatures. For example, agar melts at 85 °C (185 °F) and solidifies at 31 °C (88 °F; 304 K); this directional dependence is known as hysteresis. The melting point of ice at a pressure of 1 atmosphere is very close. [3] to 0 °C (32 °F, 273 K); this is also known as an ice point. In the presence of nucleating agents, the freezing point of water does not always coincide with the melting point. In the absence of nucleators, water can exist as a supercooled liquid down to −48.3 °C (−55 °F, 224.8 K) before freezing.
The chemical element with tungsten's highest melting point is 3414 °C (6177 °F; 3687 K);[4] this property makes tungsten ideal for use as a filament in light bulbs. The often cited carbon does not melt at atmospheric pressure, but sublimates at about 3726.85 °C (6740.33 °F; 4000.00 K); the liquid phase only exists at pressures above 10 MPa (99 atm) and estimated at 4,030–4,430 °C (7,290–8,010 °F; 4,300–4,700 K) (see). Tantalum hafnium carbide (Ta4HfC5) is a fireproof compound with a very high melting point of 4215 K (3942 °C, 7128 °F).[5] Quantum mechanical computer modeling predicted that the alloy HfN0.38C0.51 would have an even higher melting point (about 4400 K),[6] which would make it the substance with the highest melting point at atmospheric pressure. This prediction was later confirmed by experiment.[7] At the other end of the scale, helium does not freeze at normal pressure, even at temperatures arbitrarily close to absolute zero; pressure more than twenty times the normal atmospheric pressure required.
| List of common chemicals | ||||||||||||
| Chemical[I] | Density (gram/cm3) | Melt() [8] | Boil (K) | |||||||||
| Water @STP | 1 | 273 | 373 | |||||||||
| Solder (Pb60Sn40) | 456 | |||||||||||
| Coconut oil | 307.2 | — | ||||||||||
| Paraffin candle | 0.9 | 310 | 643 | |||||||||
| Hydrogen | 0.00008988 | 14.01 | 20.28 | |||||||||
| Helium | 0.0001785 | —[II] | 4.22 | |||||||||
| Beryllium | 1.85 | 1560 | 2742 | |||||||||
| Carbon | 2.267 | —[III][9] | 4000[III][9] | |||||||||
| Nitrogen | 0.0012506 | 63.15 | 77.36 | |||||||||
| Oxygen | 0.001429 | 54.36 | 90.20 | |||||||||
| Sodium | 0.971 | 370.87 | 1156 | |||||||||
| Magnesium | 1.738 | 923 | 1363 | |||||||||
| Aluminum | 2.698 | 933.47 | 2792 | |||||||||
| Sulfur | 2.067 | 388.36 | 717.87 | |||||||||
| Chlorine | 0.003214 | 171.6 | 239.11 | |||||||||
| Potassium | 0.862 | 336.53 | 1032 | |||||||||
| Titan | 4.54 | 1941 | 3560 | |||||||||
| Iron | 7.874 | 1811 | 3134 | |||||||||
| Nickel | 8.912 | 1728 | 3186 | |||||||||
| Copper | 8.96 | 1357.77 | 2835 | |||||||||
| Zinc | 7.134 | 692.88 | 1180 | |||||||||
| Gallium | 5.907 | 302.9146 | 2673 | |||||||||
| Silver | 10.501 | 1234.93 | 2435 | |||||||||
| Cadmium | 8.69 | 594.22 | 1040 | |||||||||
| Indium | 7.31 | 429.75 | 2345 | |||||||||
| Iodine | 4.93 | 386.85 | 457.4 | |||||||||
| Tantalum | 16.654 | 3290 | 5731 | |||||||||
| Tungsten | 19.25 | 3695 | 5828 | |||||||||
| Platinum | 21.46 | 2041.4 | 4098 | |||||||||
| Gold | 19.282 | 1337.33 | 3129 | |||||||||
| Mercury | 13.5336 | 234.43 | 629.88 | |||||||||
| Lead | 11.342 | 600.61 | 2022 | |||||||||
| Bismuth | 9.807 | 544.7 | 1837 | |||||||||
Notes
| ||||||||||||
Carnelli's rule
In organic chemistry, Carnelli's rule
, founded in 1882 by Thomas Carnelli, states that
high molecular symmetry is associated with high melting points
.[13] Carnelli based his rule on a study of 15,000 chemical compounds. For example, for three structural isomers with the molecular formula C5HAC12, the melting point increases in the series isopentane -160 °C (113 K), n-pentane -129.8 °C (143 K) and neopentane -16.4 °C (256.8 K ).[14] Similarly, in xylenes and dichlorobenzenes the melting point increases by the order of meta, ortho and then para. Pyridine has lower symmetry than benzene hence its temperature is lower, but the melting point increases again with diazine and triazines. Many cellular compounds such as adamantane and cubane with high symmetry have relatively high melting points.
A high melting point results from a high heat of fusion, low entropy of fusion, or a combination of both. In highly symmetric molecules, the crystalline phase is tightly packed with many effective intermolecular interactions leading to a higher enthalpy change upon melting.
Like many compounds with high symmetry, tetrakis(trimethylsilyl) silane has a very high melting point (m.p.) of 319-321 °C. It tends to be elevated, so mp determination requires the sample to be sealed in a test tube.[ 15]
Project "Absolute Zero"
Have you ever tried heating marshmallows in the microwave? As the gases inside the marshmallow heat up, the molecules begin to move faster. As they move, the molecules collide with each other and move away. When gases store more energy, they require more space. That's why it swells. French scientist Jacques Charles found a connection between changes in the state of gases and temperature back in the 1780s. He noted that if mass and pressure remain constant, the volume of the gas will increase as the temperature rises. This property of gases was called Charles's Law:
V1/T1=V2/T2.
If a gas expands as it heats up, it is logical to assume that it contracts as it cools. What happens if the temperature of the gas drops so much that all particles stop moving? This will also mean that the molecules will come as close to each other as possible, bringing the volume of the gas to zero. This is practically impossible, but scientists are thinking about it from a theoretical point of view. According to their theory, absolute zero is the temperature at which the movement of molecules stops completely.
Although it is impossible to reduce the temperature of a gas to absolute zero, you can conduct an experiment that will quantify the relationship between gases and volume. If you know the volume and temperature indicators, you can calculate everything. And if you calculate everything, you can make a guess (draw a conclusion based on the information received) and understand what absolute zero represents.
The goal is to find out how to determine the absolute zero indicator.
What we need:
- bucket;
- ice;
- large spoon;
- water;
- protective glasses;
- Erlenmeyer flask (125 ml);
- large glass (at least 500 ml);
- rubber stopper with a hole for a 125 mm flask;
- a short glass rod (5 - 10 cm), the diameter of which corresponds to the diameter of the hole in the cork;
- ring tripod;
- clamp;
- heating plate;
- tweezers that can be used to take a 125 ml flask;
- thermometer (Celsius);
- measuring cylinder;
- whatman;
- ruler.
All glass materials should be made of Pyrex glass to prevent glassware from cracking when heated.
Progress of the experiment:
- Make an ice bath: Fill a bucket with ice cubes and add cold water. The bucket should be ¾ full.
- Stir the ice and water with a large spoon from time to time.
- Place a stopper with a hole in a dry 125 ml flask.
- Prepare a container of hot water. Place a glass of water (500 ml volume) on the stove.
- Place the 125 ml flask directly and secure it. Most of the flask should be immersed in hot water.
- Boil water for 5 minutes. The empty flask should be immersed in water. This is necessary so that the gas inside the flask reaches the temperature of boiling water.
- Record the temperature of the boiling water (it should be the same as the temperature of the gas in the flask). Try to measure as accurately as possible, down to 0.1 degrees Celsius. The more accurate your measurements are, the better you will be able to determine absolute zero.
- While the glass is in the hot water, carefully insert a short glass rod through the hole in the stopper.
- Using tweezers, carefully remove the container from the hot water.
- Invert the Erlenmeyer flask and place it inside a container with ice.
- Make sure the flask is under water. Then remove the glass rod from the stopper.
- Continue holding the container in the ice water for 6-7 minutes. Stir the water and ice from time to time. Water will begin to flow into the flask. Why?
- Raise the inverted flask until the water level inside and outside is the same. This is necessary in order to equalize the atmospheric pressure and the pressure inside the container. The only indicator that will differ during this experiment is the temperature.
- Measure the temperature of the water in the ice bucket.
- Insert the glass rod through the hole in the stopper again. Remove the flask from the water and place it straight.
- Using a graduated cylinder, measure the volume of water in the flask. Try to get the most accurate results possible.
- Fill the container to the same level as the stopper.
- Using a graduated cylinder, measure the total volume of the flask.
- Extract the volume of water that entered the flask from the total volume of the flask. The resulting number corresponds to the volume of gas inside the flask after cooling.
Your data table should look something like this:
| Data | Temperature, Celsius | Volume, ml |
| 1 | (write down the temperature of the boiling water) | (total volume of flask) |
| 2 | (record the temperature of the ice water) | (total volume of the flask minus the volume of water that got inside) |
- Plot a graph with temperature on the x-axis. Temperatures can vary from -300 to 150 degrees Celsius. The volume in ml will be indicated on the y-axis. Volume indicators can vary from 150 ml to 0 ml.
- Please provide two indicators.
- Using a ruler, draw a straight line between them.
- Align the ruler with the line you started drawing. Draw a dotted line that will be a continuation of the solid line. The dotted line should reach the x-axis (mark 0).
- Determine the temperature in the area where the dotted line intersected the X-axis. This indicator will correspond to absolute zero.
Conclusion:
The expected absolute zero reading is -273.15 C. If you get a reading between -250 C and -300, consider the limitations of your equipment and charting paper. Why? After you cooled the flask in ice water, the movement of the gas molecules inside slowed down. The gas molecules began to take up less space, so water was able to penetrate into the flask. Charles's law states that as temperature decreases, volume decreases.
Another important concept related to gases, pressure and temperature is described in Gay-Lussac's law. The pressure of a fixed mass of gas at a constant temperature varies in direct proportion to the temperature. The equation for this interaction is as follows:
P1/T1=P2/T2,
You must remember that gas pressure is a force acting on a surface. One of the clearest examples of this phenomenon: when heated in a microwave oven, the cap flies out of a plastic bottle. The temperature rises, but the volume of gas remains the same (due to the lid). Consequently, when the temperature rises, the plug comes out.
Recommendations
Quotes
- Ramsay, J. A. (1 May 1949). "A new method for determining the freezing point of small quantities." Journal of Experimental Biology
.
26
(1):57–64. PMID 15406812. - Haynes, paragraph 4.122.
- The melting point of purified water is 0.002519 ± 0.000002 °C, see Feistel, R. and Wagner, W. (2006). "New equation of state for H2O Ice Ih." J. Phys.
Chem. Ref. Data .
35
(2):1021–1047. Bibcode:2006JPCRD..35.1021F. doi:10.1063/1.2183324. - Haynes, paragraph 4.123.
- Agte, C. and Alterthum, H. (1930). "Studies of systems with carbides at high melting temperatures and contributions to the problem of carbon melting." Z.Tech.
Phys .
11
: 182–191. - Hong, Q.-J.; van de Walle, A. (2015). "Prediction of the material with the highest known melting point from ab initio molecular dynamics calculations." Phys.
Ed. B. _
92
(2):020104(R). Bibcode:2015PhRvB..92b0104H. Doi:10.1103/PhysRevB.92.020104. - Buinevich, V.S.; Nepapushev, A.A.; Moskovskikh, D.O.; Trusov, G.V.; Kuskov, K.V.; Vadchenko, S.G.; Rogachev, A.S.; Mukasyan, A. (March 2022). “Production of ultra-high temperature non-stoichiometric hafnium carbonitride by combustion synthesis and spark plasma sintering methods.” Ceramics International
.
46
(10):16068–16073. doi:10.1016/j.ceramint.2020.03.158. - Holman, S.W.; Lawrence, R. R.; Barr, L. (1 January 1895). "Melting points of aluminum, silver, gold, copper and platinum." Proceedings of the American Academy of Arts and Sciences
.
31
: 218–233. doi:10.2307/20020628. JSTOR 20020628. - ^ a b
"Carbon".
rsc.org
. - The exact relationship is expressed in the Clausius–Clapeyron relation.
- "J10 Heat: change in the state of aggregation of substances through a change in heat content: change in the state of aggregation of substances and the Clapeyron-Clausius equation." Retrieved February 19, 2008.
- Tonkov, E.Yu. and Poniatowski, E.G. (2005) Phase transformations of elements under high pressure.
, CRC Press, Boca Raton, p. 98 ISBN 0-8493-3367-9 - Brown, R. J. S., & R. F. S. (2000). "Melting point and molecular symmetry". Journal of Chemical Education
.
77
(6): 724. Bibcode:2000JChEd..77..724B. Doi:10.1021/ed077p724. - Haynes, pp. 6.153–155.
- Gilman, H.; Smith, K. L. (1967). "Tetrakis (trimethylsilyl) silane." Journal of Organometallic Chemistry
.
8
(2): 245–253. Doi:10.1016/S0022-328X(00)91037-4. - Lindemann F.A. (1910). "Calculation of molecular vibration frequencies." Phys.
Z. _
11
: 609–612. - Sorkin, S., (2003), Point defects, lattice structure and melting, Dissertation, Technion, Israel.
- Philip Hofmann (2008). Solid State Physics: An Introduction
. Wiley-VCH. paragraph 67. ISBN 978-3-527-40861-0. Retrieved March 13, 2011. - Nelson D.R. (2002), Defects and geometry in condensed matter physics, Cambridge University Press, ISBN 0-521-00400-4
- Melting point prediction using SMILES. Qsardb.org. Retrieved September 13, 2013
- Bradley, Jean-Claude; Lang, Andrew; Williams, Anthony; Curtin, Evan (11 August 2011). "Open collection of ONS melting points." Nature precedes
. Doi:10.1038/npre.2011.6229.1. - OCHEM melting point models. ochem.eu. Retrieved June 18, 2016.
- Tetko, Igor V; m. Lowe, Daniel; Williams, Anthony J (2016). “Development of models to predict melting and pyrolysis temperature data associated with several hundred thousand compounds mined from PATENTS.” Journal of Chemical Informatics
.
8
: 2. Doi:10.1186/s13321-016-0113-у. PMC 4724158. PMID 26807157.
Sources
Works Cited
- Haynes, William M., ed. (2011). CRC Handbook of Chemistry and Physics
(92nd ed.). CRC Press. ISBN 978-1439855119.

