Ratio of shear stress to shear strain
| Shear modulus | |
| Common symbols | G, S |
| SI unit | pascal |
| Derivatives from other quantities | G = / G = / 2 (1+ ) |
Shear strain
In materials science, shear modulus
or
modulus of stiffness
, denoted
G
, or sometimes
S
or
M
, is a measure of the elastic shear stiffness of a material and is defined as the ratio of shear stress to shear strain: [1]
g = d e f τ x y γ x y = F / A Δ X / l = F l A Δ X {\displaystyle G\ {\stackrel {\mathrm {def} }{=}}\ {\frac {\tau _{xy}}{\gamma _{xy}}} ={\frac {F/A}{\Delta x/l}}={\frac {Fl}{A\Delta x}}}
where
τ xy = F / A {\displaystyle \tau _{xy}=F/A\,} = shear stress F {\displaystyle F} is the force that acts A {\displaystyle A} is the area that the force γ acts on xy {\displaystyle \gamma _{xy}} = shear strain. In mechanical engineering, in other := Δ x / l = tan θ {\displaystyle :=\Delta x/l=\tan \theta } := θ {\displaystyle :=\theta } Δ x {\displaystyle \Delta x } lateral displacement l {\displaystyle l} initial length
The derived unit of shear modulus in the system is the pascal (Pa), although it is usually expressed in gigapascals (GPa) or thousand pounds per square inch (ksi). Its dimensional form is M 1 l -1 T -2, replacing the forces
for
mass
acceleration
times .
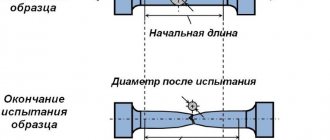
Stress diagrams
Today, there are several methods for testing material samples. At the same time, one of the simplest and most revealing tests are tensile (tensile) tests, which make it possible to determine the proportionality limit, yield strength, elastic modulus and other important characteristics of the material. Since the most important characteristic of the stressed state of a material is deformation, determining the deformation value for known dimensions of the sample and the loads acting on the sample makes it possible to establish the above characteristics of the material.
Here the question may arise: why can’t we simply determine the resistance of a material? The fact is that absolutely elastic materials, which collapse only after overcoming a certain limit - resistance, exist only in theory. In reality, most materials have both elastic and plastic properties; we will consider what these properties are below using the example of metals.
Tensile tests of metals are carried out in accordance with GOST 1497-84. For this purpose, standard samples are used. The test procedure looks something like this: a static load is applied to the sample, the absolute elongation of the sample Δl is determined, then the load is increased by a certain step value and the absolute elongation of the sample is determined again, and so on. Based on the data obtained, a graph of elongation versus load is constructed. This graph is called a stress diagram.
Figure 318.1 . Stress diagram for a steel sample.
In this diagram we see 5 characteristic points:
Proportionality limit Рп (point A)
Normal stresses in the cross section of the sample when the proportionality limit is reached will be equal to:
σп = Рп/Fo (318.2.1)
The proportionality limit limits the area of elastic deformations on the diagram. In this section, the deformations are directly proportional to the stresses, which is expressed by Hooke’s law:
Рп = kΔl (318.2.2)
where k is the stiffness coefficient:
k = EF/l (318.2.3)
where l is the sample length, F is the cross-sectional area, E is Young’s modulus.
Elastic moduli
The main characteristics of the elastic properties of materials are Young's modulus E (modulus of elasticity of the first kind, modulus of elasticity in tension), modulus of elasticity of the second kind G (modulus of elasticity in shear) and Poisson's ratio μ (transverse deformation coefficient).
Young's modulus E shows the ratio of normal stresses to relative strains within the limits of proportionality
Young's modulus is also determined empirically when testing standard tensile specimens. Since the normal stresses in the material are equal to the force divided by the initial cross-sectional area:
σ = Р/Fо (318.3.1), (317.2)
and relative elongation ε - the ratio of absolute deformation to the initial length
εpr = Δl/lo (318.3.2)
then Young’s modulus according to Hooke’s law can be expressed as follows
E = σ/εpr = Plo/FoΔl = tgα (318.3.3)
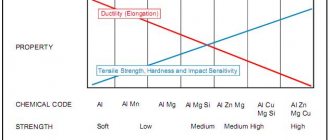
Figure 318.2 . Stress diagrams of some metal alloys
Poisson's ratio μ shows the ratio of transverse to longitudinal strains
Under the influence of loads, not only does the length of the sample increase, but also the area of the cross-section under consideration decreases (if we assume that the volume of material in the region of elastic deformation remains constant, then an increase in the length of the sample leads to a decrease in the cross-sectional area). For a sample having a circular cross-section, the change in cross-sectional area can be expressed as follows:
εpop = Δd/do (318.3.4)
Then Poisson's ratio can be expressed by the following equation:
μ = εpop/εpr (318.3.5)
The shear modulus G shows the ratio of tangential stresses t to the shear angle
The shear modulus G can be determined experimentally by testing specimens for torsion.
During angular deformations, the section under consideration does not move linearly, but at a certain angle—the shear angle γ to the initial section. Since the shear stress is equal to the force divided by the area in the plane in which the force acts:
t = P/F (318.3.6)
and the tangent of the angle of inclination can be expressed as the ratio of the absolute deformation Δl to the distance h from the place where the absolute deformation was recorded to the point relative to which the rotation was made:
tgγ = Δl/h (318.3.7)
then at small values of the shear angle the shear modulus can be expressed by the following equation:
G = m/γ = Ph/FΔl (318.3.8)
Young's modulus, shear modulus and Poisson's ratio are related to each other by the following relationship:
E = 2(1 + μ)G (318.3.9)
The values of the constants E, G and µ are given in table 318.1
Table 318.1 . Approximate values of the elastic characteristics of some materials
Note: Elastic moduli are constant values, however, manufacturing technologies for various building materials change and more accurate values of elastic moduli should be clarified according to currently valid regulatory documents. The modulus of elasticity of concrete depends on the class of concrete and therefore is not given here.
Elastic characteristics are determined for various materials within the limits of elastic deformations limited on the stress diagram by point A. Meanwhile, several more points can be identified on the stress diagram:
Elastic limit Ru
Normal stresses in the cross section of the sample when the elastic limit is reached will be equal to:
σу = Ru/Fo (318.2.4)
The elastic limit limits the area in which the appearing plastic deformations are within a certain small value, normalized by technical conditions (for example, 0.001%; 0.01%, etc.). Sometimes the elastic limit is designated according to the tolerance σ0.001, σ0.01, etc.
Yield strength RT
σт = Рт/Fo (318.2.5)
Limits the area of the diagram in which the deformation increases without a significant increase in load (yield state). In this case, a partial rupture of internal bonds occurs throughout the entire volume of the sample, which leads to significant plastic deformations. The sample material is not completely destroyed, but its initial geometric dimensions undergo irreversible changes. On the polished surface of the samples, yield figures are observed - shear lines (discovered by Professor V.D. Chernov). For different metals, the angles of inclination of these lines are different, but are in the range of 40-50o. In this case, part of the accumulated potential energy is irreversibly spent on the partial rupture of internal bonds. When testing tensile strength, it is customary to distinguish between the upper and lower yield limits - respectively, the highest and lowest stresses at which plastic (residual) deformation increases at an almost constant value of the acting load.
The stress diagrams indicate the lower yield strength. It is this limit for most materials that is taken as the standard resistance of the material.
Some materials do not have a pronounced yield plateau. For them, the conditional yield strength σ0.2 is taken to be the stress at which the residual elongation of the sample reaches a value of ε ≈0.2%.
Tensile strength Pmax (temporary strength)
Normal stresses in the cross section of the sample when the ultimate strength is reached will be equal to:
σв = Рmax/Fo (318.2.6)
After overcoming the upper yield limit (not shown in the stress diagrams), the material again begins to resist loads. At maximum force Pmax, complete destruction of the internal bonds of the material begins. In this case, plastic deformations are concentrated in one place, forming a so-called neck in the sample.
The stress at maximum load is called the tensile strength or tensile strength of the material.
Tables 318.2 - 318.5 provide approximate values of tensile strength for some materials:
Table 318.2 Approximate compressive strength limits (tensile strengths) of some building materials.
Note : For metals and alloys, the value of tensile strength should be determined in accordance with regulatory documents. The value of temporary resistances for some steel grades can be found here.
Table 318.3 . Approximate strength limits (tensile strengths) for some plastics
Table 318.4 . Approximate tensile strengths for some fibers
Table 318.5 . Approximate strength limits for some wood species
Destruction of PP material
If you look at the stress diagram, it seems that the destruction of the material occurs as the load decreases. This impression is created because as a result of the formation of a “neck,” the cross-sectional area of the sample in the area of the “neck” changes significantly. If you construct a stress diagram for a sample made of low-carbon steel depending on the changing cross-sectional area, you will see that the stresses in the section under consideration increase to a certain limit:
Figure 318.3 . Stress diagram: 2 - in relation to the initial cross-sectional area, 1 - in relation to the changing cross-sectional area in the neck area.
Nevertheless, it is more correct to consider the strength characteristics of the material in relation to the area of the original section, since strength calculations rarely include changes in the original geometric shape.
One of the mechanical characteristics of metals is the relative change ψ of the cross-sectional area in the neck area, expressed as a percentage:
ψ = 100(Fo - F)/Fo (318.2.7)
where Fo is the initial cross-sectional area of the sample (cross-sectional area before deformation), F is the cross-sectional area in the neck region. The higher the value of ψ, the more pronounced the plastic properties of the material are. The lower the value of ψ, the greater the fragility of the material.
If you add up the torn parts of the sample and measure its elongation, it turns out that it is less than the elongation in the diagram (by the length of the segment NL), since after rupture the elastic deformations disappear and only plastic deformations remain. The amount of plastic deformation (elongation) is also an important characteristic of the mechanical properties of the material.
Beyond elasticity, up to fracture, total deformation consists of elastic and plastic components. If you bring the material to stresses exceeding the yield strength (in Fig. 318.1, some point between the yield strength and the tensile strength), and then unload it, then plastic deformations will remain in the sample, but when reloaded after some time, the elastic limit will become higher, since in this case, a change in the geometric shape of the sample as a result of plastic deformations becomes, as it were, the result of the action of internal connections, and the changed geometric shape becomes the initial one. This process of loading and unloading material can be repeated several times, and the strength properties of the material will increase:
Figure 318.4 . Stress diagram during work hardening (inclined straight lines correspond to unloading and repeated loading)
This change in the strength properties of a material, obtained through repeated static loading, is called work hardening. However, when the strength of a metal increases by cold hardening, its plastic properties decrease and its fragility increases, so relatively small hardening is usually considered useful.
Young's modulus values for some materials
The table shows the E values of a number of common substances.
| Material | Young's modulus E, GPa |
| Aluminum | 70 |
| Bronze | 75-125 |
| Tungsten | 350 |
| Graphene | 1000 |
| Brass | 95 |
| Ice | 3 |
| Copper | 110 |
| Lead | 18 |
| Silver | 80 |
| Gray cast iron | 110 |
| Steel | 200/210 |
| Glass | 70 |
The longitudinal elastic modulus of steel is twice the Young's modulus of copper or cast iron. Young's modulus is widely used in formulas for strength calculations of structural elements and products in general.
Read also: Operating principle of the hydraulic bottle jack
Work of deformation
The greater the internal forces of interaction between the particles of the material, the higher the strength of the material. Therefore, the value of elongation resistance per unit volume of a material can serve as a characteristic of its strength. In this case, the tensile strength is not an exhaustive characteristic of the strength properties of a given material, since it characterizes only the cross sections. When a rupture occurs, the interconnections are destroyed over the entire cross-sectional area, and during shears, which occur during any plastic deformation, only local interconnections are destroyed. To destroy these connections, a certain amount of work of internal interaction forces is expended, which is equal to the work of external forces expended on displacement:
A = РΔl/2 (318.4.1)
where 1/2 is the result of the static action of the load, increasing from 0 to P at the time of its application (average value (0 + P)/2)
During elastic deformation, the work of forces is determined by the area of the triangle OAB (see Fig. 318.1). Total work expended on the deformation of the sample and its destruction:
A = ηРmaxΔlmax (318.4.2)
where η is the coefficient of completeness of the diagram, equal to the ratio of the area of the entire diagram, limited by the curve AM and straight lines OA, MN and ON, to the area of a rectangle with sides 0Рmax (along the P axis) and Δlmax (dotted line in Fig. 318.1). In this case, it is necessary to subtract the work determined by the area of the triangle MNL (related to elastic deformations).
The work spent on plastic deformation and destruction of the sample is one of the important characteristics of the material that determines the degree of its fragility.
General concept
With any external influence on an object, counter forces arise inside it, compensating for the external ones. For ideal systems in equilibrium, the forces are evenly distributed and equal, which allows the object to maintain its shape. Real systems do not obey such rules, which can lead to their deformation. When assessing the strength of materials, they talk about their elasticity.
Determination of Young's modulus of solids
Elastic materials are those that, after the cessation of external influence, restore their original shape.
Read also: What kind of load can a sip cable withstand?
Internal forces are distributed evenly over the entire cross-sectional area of the object, have their own intensity, which is expressed quantitatively, called stress (p) and measured in N/m 2 or according to the international Pa system.
The stress has its own spatial direction: perpendicular to the cross-sectional area of the object - normal stress (σz) and lying in the cross-sectional plane - tangential stress (τz).
Experience with spring scales
The modulus of elasticity (E) as a unit of measurement of the ratio of a material to linear deformation, and normal stress are related by the formula of Hooke's law:
where ε is the relative elongation or deformation.
Having transformed formula (1) to express the normal stress from it, you can see that E is constant at relative elongation, and is called the stiffness coefficient, and its units are Pa, kgf/mm 2 or N/m 2:
The modulus of elasticity is a unit of measurement of the ratio of stress created in a material to linear deformation, such as tension and compression.
In reference materials, the dimension of the elastic modulus is expressed in MPa, since deformation has a rather small value. And the relationship between these quantities is inversely proportional. Thus, E has a high value, defined as 107-109.
Compression strain
Compressive deformations are similar to tensile deformations: first, elastic deformations occur, to which plastic deformations are added beyond the elastic limit. The nature of deformation and fracture during compression is shown in Fig. 318.5:
Figure 318.5
a - for plastic materials; b - for brittle materials; c - for wood along the grain, d - for wood across the grain.
Compression tests are less convenient for determining the mechanical properties of plastic materials due to the difficulty of recording the moment of failure. Methods of mechanical testing of metals are regulated by GOST 25.503-97. When testing for compression, the shape of the sample and its dimensions may be different. Approximate values of tensile strength for various materials are given in tables 318.2 - 318.5.
If the material is under load at a constant stress, then additional elastic deformation is gradually added to the almost instantaneous elastic deformation. When the load is completely removed, the elastic deformation decreases in proportion to the decreasing stresses, and the additional elastic deformation disappears more slowly.
The resulting additional elastic deformation under constant stress, which does not disappear immediately after unloading, is called elastic aftereffect.
Strain – dimensionless number
The use of the concept of “deformation” makes it possible to quantitatively describe changes in the size and shape of a body that occur when stresses are applied, which, in turn, arise when a certain load is applied. It is important to note that strain is a “pure”, dimensionless number. Strain does not have any units of measurement. To calculate the deformation, you need to compare the initial, original dimensions or shape of a body before applying a load with the same dimensions or shape of the same body under load.
The formula used to calculate deformation has values of the same dimension (meters, centimeters, millimeters) in both the denominator and numerator. Therefore, it is clear from school physics that these dimensional units cancel each other, and as a result we get a dimensionless number. This procedure is clearly visible when calculating stresses and strains for a simple tensile test.
The influence of temperature on changes in the mechanical properties of materials
The solid state is not the only state of matter. Solids exist only in a certain range of temperatures and pressures. An increase in temperature leads to a phase transition from solid to liquid, and the transition process itself is called melting. Melting points, like other physical characteristics of materials, depend on many factors and are also determined experimentally.
Table 318.6 . Melting points of some substances
Note : The table shows melting points at atmospheric pressure (except helium).
The elastic and strength characteristics of materials given in tables 318.1-318.5 are determined, as a rule, at a temperature of +20°C. GOST 25.503-97 allows testing of metal samples in the temperature range from +10 to +35°C.
When the temperature changes, the potential energy of the body changes, which means the value of the internal interaction forces also changes. Therefore, the mechanical properties of materials depend not only on the absolute value of temperature, but also on the duration of its action. For most materials, when heated, the strength characteristics (σп, σт and σв) decrease, while the plasticity of the material increases. As the temperature decreases, the strength characteristics increase, but at the same time the fragility increases. When heated, Young's modulus E decreases, and Poisson's ratio increases. When the temperature decreases, the reverse process occurs.
Figure 318.6 . The influence of temperature on the mechanical characteristics of carbon steel.
When non-ferrous metals and alloys made from them are heated, their strength immediately drops and at a temperature close to 600° C, it is practically lost. The exception is aluminothermic chromium, the tensile strength of which increases with increasing temperature and at a temperature of 1100° C reaches a maximum σв1100 = 2σв20.
The ductility characteristics of copper, copper alloys and magnesium decrease with increasing temperature, while those of aluminum increase. When plastics and rubber are heated, their tensile strength decreases sharply, and when cooled, these materials become very brittle.
Shear modulus equation
The shear modulus is determined by measuring the deformation of a solid body from the application of a force parallel to one surface of the solid body, while an opposing force acts on its opposite surface and holds the solid body in place. Think of shear as pushing one side of a block with friction as the opposing force. Another example is trying to cut wire or hair with dull scissors.
Equation for shear modulus:
G = τ xy /γ xy = F/A/Δx/l = Fl/AΔx
Where:
- G - shear modulus or stiffness modulus
- τ xy—shear stress
- γ xy—shear strain
- A is the area affected by the force
- Δx - lateral displacement
- l - initial length
The shear strain is Δx/l = tan θ or sometimes = θ, where θ is the angle formed by the strain caused by the applied force.
Effect of radioactive irradiation on changes in mechanical properties
Radiation exposure affects different materials differently. Irradiation of materials of inorganic origin in its effect on mechanical characteristics and plasticity characteristics is similar to a decrease in temperature: with an increase in the dose of radioactive irradiation, the tensile strength and especially the yield strength increase, and the plasticity characteristics decrease.
Irradiation of plastics also leads to an increase in fragility, and irradiation has different effects on the tensile strength of these materials: on some plastics it has almost no effect (polyethylene), in others it causes a significant decrease in tensile strength (katamen), and in others it increases the tensile strength (selectron ).
Lecture 3. Structural calculation methods.
Isotropic and anisotropic materials
Some materials are shear isotropic, meaning that the deformation in response to force is the same regardless of orientation. Other materials are anisotropic and respond differently to stress or strain depending on orientation. Anisotropic materials are much more susceptible to shear along one axis than the other. For example, consider the behavior of a block of wood and how it might respond to a force applied parallel to the grain of the wood compared to its response to a force applied perpendicular to the grain. Let's consider how a diamond reacts to an applied force. The rate of crystal shear depends on the orientation of the force relative to the crystal lattice.