Tensile strength
A certain threshold value for a specific material, exceeding which will lead to the destruction of the object under the influence of mechanical stress. The main types of strength limits: static, dynamic, compressive and tensile. For example, the tensile strength is the limit value of a constant (static limit) or variable (dynamic limit) mechanical stress, exceeding which will rupture (or unacceptably deform) the product. Unit of measurement: Pascal [Pa], N/mm² = [MPa].
BASIC POINTS
Metals and alloys used as structural materials must have certain mechanical properties - strength, elasticity, ductility, hardness.
Strength is the ability of a metal to resist deformation and destruction.
Deformation is a change in the size and shape of a body under the influence of external forces. Deformations are divided into elastic and plastic. Elastic deformations disappear, and plastic deformations remain after the end of the forces. Plastic deformations are based on irreversible movements of atoms from their original positions to distances greater than interatomic distances, changes in the shape of individual metal grains, and their location in space.
The ability of metals to deform plastically is called plasticity. Plasticity ensures the structural strength of parts under load and neutralizes the influence of stress concentrates - holes, cutouts, etc. During plastic deformation of a metal, simultaneously with a change in shape, a number of properties change; in particular, during cold deformation, strength increases, but ductility decreases.
Most of the mechanical characteristics of the metal are determined by tensile testing of samples (GOST 1497-84).
When stretching samples with cross-sectional area Fo and working (calculated) length lo, a tensile diagram is constructed in the coordinates: load P – elongation Dl of the sample (Fig. 1).
The tensile diagram characterizes the behavior of the metal during deformation from the moment the loading begins until the destruction of the sample. The diagram distinguishes three sections: elastic deformation - up to load Rupr; uniform plastic deformation from Rupr to Pmax and concentrated plastic deformation from Pmax to Pk. If the sample is loaded within the limits of Rupr, and then completely unloaded and its length is measured, then no consequences of loading will be detected. This type of sample deformation is called elastic. When the sample is loaded more than Rupr, residual (plastic) deformation appears. Plastic deformation occurs under increasing load, since the metal is strengthened during deformation. Hardening of metal during deformation is called cold hardening. With further loading, the plastic deformation, and with it the hardening, increases more and more, evenly distributed throughout the entire volume of the sample. After reaching the maximum value of the load Pmax, a local thinning of the sample appears in the weakest place - the neck, in which further plastic deformation mainly occurs. At this time, cracks may appear between the deformed grains, and sometimes even inside the grains themselves. Due to the development of the neck, despite the continuing strengthening of the metal, the load decreases from Pmax to Pk, and at load Pk the sample is destroyed. In this case, the elastic deformation of the sample (Dlур) disappears, but the plastic deformation (Dlоst) remains (Fig. 1).
Rice. 1. Metal tensile diagram
When a solid body is deformed, internal forces arise inside it. The magnitude of forces per unit cross-sectional area of the sample is called stress. Voltage dimension kgf/mm
2 or
MPa
(1
kgf/mm2
=10
MPa
). The above-mentioned loads on the tensile curve (Rupr, Рт, Рmax, Рк) serve to determine the main characteristics of strength (stresses): elastic limit, physical yield strength, tensile strength (tensile strength) and true fracture resistance.
In technical calculations, instead of the ultimate strength, the conditional yield strength is usually used, which corresponds to the load P0.2 (Fig. 2).
Rice. 2. Section of the metal tensile diagram
When stretched, the sample elongates and its cross-section continuously decreases. But since it is difficult to determine the cross-sectional area of a sample at any given moment, when calculating the elastic limit, yield strength and tensile strength, conditional stresses are used, assuming that the cross-section of the sample remains unchanged. The true stress is calculated only when determining the fracture resistance. Conditional yield strength (s0.2) is the stress at which the sample receives a residual (plastic) elongation equal to 0.2% of its calculated length:
,
where P0.2 is the load causing residual (plastic) elongation equal to 0.2%, kgf
(N);
Fо – initial cross-sectional area of the sample,
mm2
.
Tensile strength (tensile strength) sв is the stress corresponding to the greatest load preceding the failure of the sample.
,
where Pmax is the maximum load preceding failure, kgf (H)
. Temporary resistance (tensile strength) characterizes the load-bearing capacity of a material, its strength prior to destruction. True fracture strength (Sk) – true stress preceding the moment of sample failure
,
where Pk is the load immediately preceding the moment of destruction, kgf (N)
.
Fк – cross-sectional area of the sample at the point of destruction, mm2
.
Despite the fact that Pmax is greater than Pk, the true fracture resistance Sc > sв, since the cross-sectional area of the sample at the point of destruction Fк is significantly less than the initial cross-sectional area Fo.
To assess the ductility of a metal, use the relative elongation of the sample under tension (d, %
) and the relative narrowing of the cross-sectional area of the sample (y,
%
).
Relative elongation after rupture (d, %
) is determined by the formula:
where lк is the working length of the sample after testing, mm
;
lо – working length before testing, mm
.
Relative narrowing of the cross section after rupture (y, %
) is determined from the expression:
where Fo is the initial cross-sectional area of the sample, mm2
;
Fк – cross-sectional area of the sample together with destruction, mm2
.
In practice, to determine the load that causes deformation corresponding to the proof stress, the following steps should be performed. On the tension diagram, draw a straight line OA (Fig. 2), coinciding with the straight section of the tension diagram. Determine the position of point O. Draw the ordinate axis OP through point O. The scale of recording the diagram by load: one millimeter of ordinate corresponds to 2 kgf
loads.
The numerical value of the required load P ( kgf
) is equal to the corresponding ordinate of the diagram (
mm
) multiplied by the scale of the diagram (2
kgf/mm
).
To determine the load corresponding to the conditional yield strength P0.2, it is necessary to plot a segment OB from the origin along the abscissa axis, the value of which is equal to the specified residual elongation of 0.2%. The length of the segment OB ( mm
) is calculated by the formula:
,
where lо – working length of the sample, mm
; M – scale of deformation diagram recording.
From point B, draw a straight line VD parallel to the straight section of the tension diagram (Fig. 2) until it intersects with the diagram.
Using the known scale of recording the load diagram, determine the numerical values of the loads P02, Pmax, Pk, and then calculate the corresponding voltage: s0.2, sv, Sk. Record the obtained data in the test report.
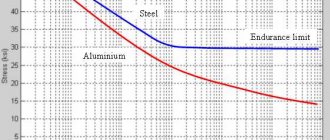
Endurance limit or fatigue limit (σR)
The ability of a material to withstand loads that cause cyclic stress. This strength parameter is defined as the maximum stress in a cycle at which fatigue failure of the product does not occur after an indefinitely large number of cyclic loads (the basic number of cycles for steel is Nb = 10 7 ). The coefficient R (σR) is taken to be equal to the cycle asymmetry coefficient. Therefore, the fatigue limit of the material in the case of symmetric loading cycles is denoted as σ-1, and in the case of pulsating ones - as σ.
Note that fatigue tests of products are very long and labor-intensive; they involve the analysis of large volumes of experimental data with an arbitrary number of cycles and a significant scatter of values. Therefore, special empirical formulas are most often used that connect the endurance limit with other strength parameters of the material. The most convenient parameter is considered to be the tensile strength.
For steels, the bending endurance limit is usually half the tensile strength: For high-strength steels, you can take:
For ordinary steels during torsion under conditions of cyclically changing stresses, the following can be accepted:
The above ratios should be used with caution, because they were obtained under specific loading conditions, i.e. during bending and torsion. However, when testing in tension-compression, the endurance limit becomes approximately 10-20% less than in bending.
Proportionality limit
This is an indicator that determines the duration of the loads applied to the deformation of the body. In this case, both values should change to different degrees according to Hooke’s law. In simple words: the greater the compression (tension), the more the sample is deformed.
The value of each material lies between absolute and classical elasticity. That is, if the changes are reversible after the force ceases to act (the shape becomes the same - for example, compression of a spring), then such parameters cannot be called proportional.
Relationship between yield stress and tensile strength
and tensile strength is established by the relationship between the extrapolated yield strength and σ B. Since the extrapolated yield stress can be used to fairly accurately determine the yield stress for most materials, starting with the degree of deformation , this assumption can be considered justified.
Below we consider the relationships between the tensile strength and the extrapolated yield strength of the hardening curves under tension of the first kind and under compression of the second kind.
The extrapolated yield strength of the first-order tensile hardening curves is found at the intersection of the tangent to the hardening curve at the point where necking begins with the ordinate. For hardening curves of the second kind under compression, the extrapolated yield strength S0 (see Fig. 1) is the stress corresponding in magnitude to the ordinate segment cut off by the straight line, which is a continuation of section III of the hardening curve.
According to the theoretical calculations of M.P. Markovets for materials with uniform relative transverse contraction Ψ B
no more than 0.15, the difference between the extrapolated yield strength determined from the tensile hardening curves and the tensile strength σ
B
does not exceed 3%, and with Ψ
B
up to 0.2 - no more than 7%.
In this case, it should always be less than the value of
σ B.
The theoretically established relationship between and σ B
M.P.
Markovets confirmed it experimentally. It was shown that, regardless of the type of material (non-ferrous and ferrous metals), the type of previous heat treatment (annealing, normalization, hardening, hardening + tempering) and strength (the materials studied were 20-180 kg/mm2), the ratio for materials with up to 15% close to unity (Fig. 1). Only for brass and austenitic steel EI69, for which the value of Ψ B
reaches 30%, this ratio is 1.2-1.3.
P. Markovets also did a lot of work on comparing and σ B
according to experimental data from other researchers - N.N. Davidenkov, Kerber and Roland.
It was found that the data of various authors, obtained experimentally in different laboratories on a huge number of metals and alloys (aluminum, copper and their alloys, carbon and alloy steels) at room and elevated temperatures (from 20 to 300°C), confirm the theoretically established pattern for metals and alloys for which Ψ B
does not exceed 15%.
Let us experimentally determine the relationship between the extrapolated compressive yield stress S0 and σ B
.
Carbon and alloy hot-rolled and heat-treated steels served as the material under study (Table 1). Strengthening curves were plotted based on the results of upsetting of samples with cylindrical end recesses. The comparison results are graphically depicted in Fig. 1, from which it can be seen that there is a linear relationship between the values of S0 and σ B
, regardless of the brand of the product and the type and mode of pre-treatment.
Mathematical processing of experimental data shows that S0 is on average less than σ B
by about 6%, i.e.
The experimental data obtained are consistent with the experimental and theoretical data of M. P. Markovets on the relationship between the extrapolated tensile yield strength and σ B
in the sense that S0 is less than σ
B
by approximately the same amount.
Table 1
Chemical composition and type of previous processing of steels for which a relationship was established between the extrapolated compressive yield strength S0 and the ultimate strength σ B
| Steel | Previous processing | Element content in % | |||||
| C | Mn | Si | Cr | Ni | Mo | ||
| 10 | Hot rolling | 0,11 | 0,45 | 0,21 | — | — | — |
| 15 | Same | 0,15 | 0,43 | 0,27 | — | — | — |
| 20 | » | 0,19 | 0,37 | 0,37 | — | — | — |
| 15X | » | 0,13 | 0,42 | 0,32 | 0,90 | — | — |
| 20X | » | 0,24 | 0,67 | 0,25 | 0,91 | — | — |
| 45X | » | 0,44 | 0,61 | 0,19 | 0,90 | — | — |
| 12ХНЗА | » | 0,13 | 0,26 | 0,64 | 2,95 | — | |
| 12ХНЗА | Annealing, normalization | 0,16 | 0,40 | 0,36 | 0,66 | 2,81 | — |
| 40ХНМА | Annealing, normalization, improvement (t0 mn=600°C) | 0,37 | 0,60 | 0,24 | 0,66 | 1,39 | 0,15-0,25 |
How are the properties of metals determined?
They check not only what is called tensile strength, but also other characteristics of steel, for example, hardness. The tests are carried out as follows: a ball or cone made of diamond, the most durable rock, is pressed into the sample. The stronger the material, the smaller the mark left. Deeper, wider-diameter prints are left on soft alloys. Another experience - for a blow. The impact occurs only after a pre-made cut on the workpiece. That is, the destruction is checked for the most vulnerable area.
Tensile strength of steel
Steel structures have long replaced other materials, as they have excellent performance characteristics - durability, reliability and safety. Depending on the technology used, it is divided into brands. From the most common with a PP of 300 MPa, to the hardest with a high carbon content - 900 MPa. This depends on two indicators:
- What heat treatment methods were used - annealing, hardening, cryotreatment.
- What impurities are contained in the composition. Some are considered harmful, they are discarded for the purity of the alloy, and others are added to strengthen them.
Proportional limit (σ)
The maximum stress value for a particular material at which Hooke’s law still applies, i.e. The deformation of the body is directly proportional to the applied load (force). Please note that for many materials, reaching (but not exceeding!) the elastic limit leads to reversible (elastic) deformations, which, however, are no longer directly proportional to stress. In this case, such deformations may be somewhat “lag” relative to the increase or decrease in load.
Diagram of the deformation of a metal sample under tension in the coordinates elongation (Є) - stress (σ).
Source: www.smalley.ru